
The U.S. stock market, as measured by the S&P 500 index
,
registered new all-time highs last week but has pulled back slowly this week so far. As of last Friday, the index had made a new all-time high on 13 of the previous 25 trading days. That’s impressive.
The S&P 500 probably deserves a rest, and a pullback to 4,983 would fill the gap on its chart (circled on the accompanying SPX chart). That would be healthy. Below there, short-term support exists at 4,950; 4,920; and 4,850 — all recent weekly lows. There is stronger support at 4,800, which had been the all-time high for almost two years and which was a short-term resistance area this past December and January.
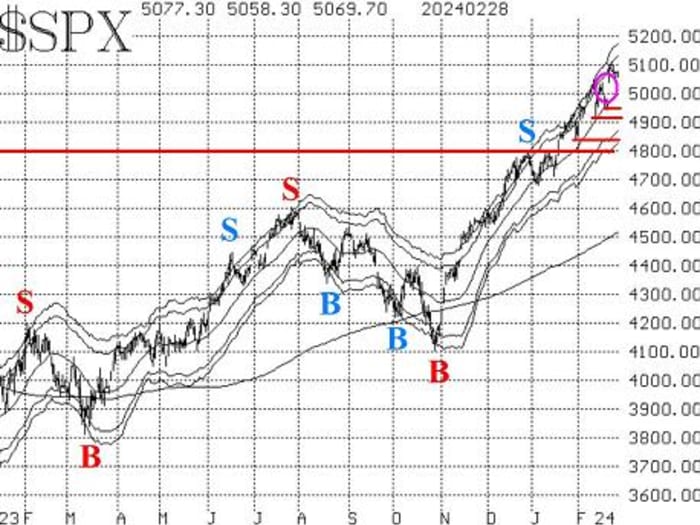
The S&P 500 has not risen above the +4σ “modified Bollinger Band,” which means that the “classic” sell signal is still in place. We do not trade the “classic” signals because of their frequent whipsaws. Rather we wait for a confirmed McMillan Volatility Band sell signal, which would only be fulfilled if the index were to fall to 4,903. That seems highly unlikely in the short term, so for all practical purposes, this signal needs to “reset.” That can only happen if the index closes above the +4σ Band, which is currently at 5,180 and rising.
Equity-only put-call ratios have drifted back down to near-recent lows. While it is technically true that the computer programs we use to analyze these charts had declared that the ratios were ready to roll over to sell signals, that has not happened. They would be on sell signals if they were to rise strongly from these levels — much like what happened at the beginning of August last year. (See the accompanying put-call-ratio charts.) So these ratios are in an overbought state at the current time, but they are not on sell signals — and won’t be until they begin to rise.


“New highs on the NYSE have continued to completely dominate new lows.”
Breadth has been just strong enough to avoid a sell signal. We track two versions of breadth: the New York Stock Exchange and “stocks only,” where “stocks only” refers to all optionable stocks — more than 6,000 currently. “Stocks only” breadth has been stronger for the past few days, and that is a positive sign. Still, it wouldn’t take much in the way of negative breadth to roll these oscillators over to sell signals.
New highs on the NYSE have continued to completely dominate new lows. Thus, this indicator continues to remain strongly on a buy signal.
The Cboe Volatility Index
had spiked a couple of weeks ago but is down to benign levels again. Thus, the “spike peak” buy signal remains in effect. It lasts for 22 trading days or until VIX closes above its previous peak, near 18. In addition, VIX has dropped back below its 200-day moving average and remained there for a week, so the trend of VIX is now downward again and that, too, is bullish for stocks.

As the accompanying VIX chart shows, the 20-day moving average continues to slowly rise. If both VIX and the 20-day MA cross above the 200-day MA, that would be a sell signal. I wouldn’t say it’s imminent, but it is possible in the near term.
The construct of volatility derivatives continues to paint a bullish picture for stocks. The term structures are sloping upward, and the VIX futures are trading at a strong premium to VIX.
In summary, we are maintaining our “core” bullish position because of the positive nature of the S&P 500 and the lack of confirmed sell signals from our indicators. If other confirmed signals should appear, we will trade them around the “core” position.
New recommendation: APA Corp.
Last week, we made three conditional recommendations. None of them were filled. We are repeating all three of them, for the data on which they were based still makes them viable trades.
There is a weighted put-call-ratio buy signal in APA Corp.
APA.
It has a modestly successful history of put-call-ratio signals. However, we want to make sure the stock is moving upward when we enter, so this is a conditional recommendation:
If APA closes above $32.50, then buy 3 APA May (17) 32.5 calls in line with the market. If the calls are bought, we will hold as long as the weighted put-call ratio remains on a buy signal.
New recommendation: Potential MVB sell signal
This is a repeat recommendation and, frankly, the S&P 500 has not come close to triggering this sell signal. But it is still a possibility as long as the “classic” sell signal is in place. That “classic” signal would be stopped out by the index closing above its +4σ Band, which is currently at 5,180 and rising. Otherwise, the following recommendation remains open:
If SPX trades at 4,903 or lower, then buy 1 SPY
March (28) at-the-money put and sell 1 SPY March (28) put with a striking price 25 points lower.
If this trade is established, it would have a target of the lower -4σ Band, and it would be stopped out if SPX were to close above the +4σ Band.
New recommendation: Baker Hughes
The weighted put-call ratio for Baker Hughes
BKR
remains on a buy signal. However, there is some overhead resistance in place, so we are going to make this a conditional recommendation. This recommendation was made last week, but remains open for this week since it was not filled:
If BKR closes above $30, then buy 4 BKR April (19) 30 calls in line with the market. If these calls are bought, we will hold as long as the weighted put-call ratio remains on a buy signal.
Market insight: When stocks leave the Dow
Walgreens Boots Alliance
WBA
was dropped from the Dow Jones Industrial Average
this week in favor of Amazon.com
AMZN.
The Dow doesn’t change much over the years. This is only the seventh change since 2015 and the first since August 2020. Ironically, in 2018, General Electric
GE
was dropped and Walgreens was added.
Most often, the stock dropped from the Dow rallies shortly thereafter and sometimes rallies a lot. Here are charts of two examples: Exxon-Mobil
XOM
and Raytheon Technologies
RTX,
which were dropped on Aug. 31, 2020 in favor of Salesforce.com
CRM
and Honeywell International
HON.


Pfizer
PFE
was dropped on that same date in 2020 and rallied strongly, although that rally had a lot to do with its COVID-19 vaccine. Going farther back, AT&T
T
rallied after being dropped in 2015, but GE and DuPont de Nemours Inc.
DD
did not rally after they were dropped in 2018 and 2019, respectively.
Here is the current chart of WBA:

I’d prefer to see it attempt to rally before buying, but I think the following is a reasonable approach: If WBA closes above $22.50, then buy 4 WBA June (21) 22.5 calls in line with the market. If the recommendation is filled, we’ll take a longer-term approach and try to give the stock room to run.
Follow-up action
All stops are mental closing stops unless otherwise noted.
We are using a “standard” rolling procedure for our SPY spreads: In any vertical bull or bear spread, if the underlying hits the short strike, then roll the entire spread. That would be roll up in the case of a call bull spread or roll down in the case of a bear put spread. Stay in the same expiration and keep the distance between the strikes the same unless otherwise instructed.
Long 4 XLP
March (15) 73 calls: The stop remains at 72.60.
Long 2 SPY March (8) 509 calls: This position was initially a long straddle. It was rolled up, and the puts were sold. The calls were rolled up several more times, including last Friday, when SPY traded at 509. This is, in essence, our “core” bullish position. Roll the calls up every time they become at least eight points in the money.
Long 1 SPY March (8) 508 call: This was originally a long straddle. The call was rolled up and the put was sold. The call was rolled up on Feb. 22, when SPY traded at 508. Roll up every time the call is eight points in the money.
Long 3 TLT
May (19) 95 puts: We will hold as long as the put-call-ratio sell signal is in place for U.S. Treasury bonds.
Long 1 SPY March (8) 510 call: This call was bought in line with the new highs versus new lows buy signal. It was rolled up on Feb. 23, when SPY traded at 510. Stop out if NYSE new lows exceed new highs for two consecutive days. Roll up every time the call is eight points in the money.
Long 2 SPY March (15) 508 calls: Bought in line with the most recent VIX “spike peak” buy signal. We will hold for 22 trading days, or about one calendar month. Moreover, the trade would be stopped out if VIX subsequently closed above 17.94. The calls were rolled up when SPY traded at 508 on Feb. 22.
All stops are mental closing stops unless otherwise noted.
Send questions to lmcmillan@optionstrategist.com.
Lawrence G. McMillan is president of McMillan Analysis, a registered investment and commodity trading advisor. McMillan may hold positions in securities recommended in this report, both personally and in client accounts. He is an experienced trader and money manager and is the author of the best-selling book, Options As A Strategic Investment. www.optionstrategist.com
©McMillan Analysis Corporation is registered with the SEC as an investment advisor and with the CFTC as a commodity trading advisor. The information in this newsletter has been carefully compiled from sources believed to be reliable, but accuracy and completeness are not guaranteed. The officers or directors of McMillan Analysis Corporation, or accounts managed by such persons may have positions in the securities recommended in the advisory.